Geospatial intelligence (GEOINT) has become an indispensable tool in understanding complex global challenges, and nowhere is this more evident than in the study of North Korea.
In the subject Contemporary Politics of Northeast Asia: North Korea, which I taught at La Trobe University, I introduced students GEOINT analysis by means of a hands-on geospatial “treasure hunt”. By using Google Earth to analyse key landmarks in North Korea, students were able to explore North Korea’s topography, key infrastructure, and important political and military sites.
Geospatial intelligence (GEOINT) analysis involves the collection, interpretation, and analysis of geospatial data to provide actionable insights for decision-making, typically in the context of national security, military operations, or environmental monitoring. It combines geographic information system (GIS) technology with remote sensing, satellite imagery, and mapping to identify patterns, trends, and relationships in spatial data.
Teaching undergraduate students in North Korean Studies to use Google Earth for GEOINT analysis serves both academic and practical purposes, enhancing students’ analytical, technical, and interdisciplinary skills. Geospatial analysis cultivates critical thinking by enabling students to interpret visual data, identify patterns, and draw evidence-based conclusions, while also integrating satellite imagery with other sources, such as field studies and reports.
This activity hones students’ digital literacy and analytical skills, and also deepens their understanding of how geospatial data can illuminate North Korea’s political and strategic vulnerabilities, and how GEOINT can inform critical policy decisions.
Learning context
North Korea Studies is a challenging field, deeply influenced by the region’s history of colonialism, war, division, and authoritarianism, as well as the power dynamics of great power politics. The DPRK presents a complex and unique case study that challenges students to explore the interplay between global, regional, national, and personal factors in shaping its outcomes.
In Contemporary Politics of Northeast Asia: North Korea, students will delve deeper than popular media portrayals, confronting the moral and ethical discomfort of understanding a regime with a severe human rights record. By engaging with this difficult subject, they will seek to answer key questions: Why is North Korea the way it is? How does it interact with the world, and what implications does this have for the international community’s approach to the DPRK?
In addressing these core questions, students were encouraged to identify key actors and issues in Korean Peninsula politics, apply theoretical frameworks to North Korea’s political landscape, and utilise diverse communication methods to present their investigative findings.
The geospatial treasure hunt is conducted in a blended learning format, accommodating students in the classroom on campus and attending online via Zoom.
The Google Earth treasure hunt
This North Korea Google Earth treasure hunt unfolds in three sequential parts, including elements of individual research and group collaboration.
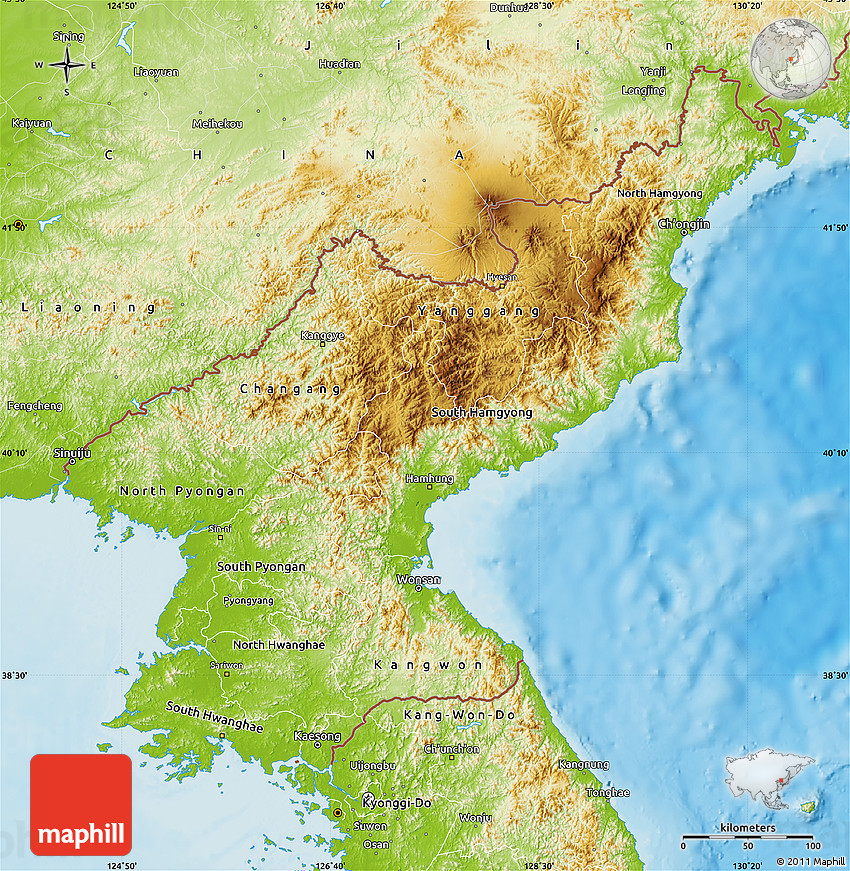
Part I: Topographic map analysis
The activity begins with a brainstorming session, where the class examines what can be deduced from a topographic map of North Korea. This initial exercise equips students with a foundational understanding of how landscapes influence geopolitical realities.
A topographic map provides valuable insights into various aspects of a region, allowing us to deduce information about:
- Settlement patterns: The distribution of settlements can be inferred from the map’s indication of populated areas, roads, and proximity to key resources like rivers, coastlines, or fertile land. Settlements tend to cluster in areas with easy access to water, fertile land, or transportation routes, which are typically visible on the map.
- Watersheds and river systems: A topographic map reveals the flow of water through the landscape, showing river valleys, lakes, and watershed boundaries. Elevation lines (contours) help determine the direction of water flow, and the presence of river systems can be deduced based on the land’s topography and the locations of water bodies.
- Infrastructure networks: Roads, railways, and other transportation networks are typically shown on a topographic map. These features can reveal how a region is connected internally and externally, and may suggest the focus of urban development and trade routes.
- Connections to neighbouring countries: Borderlines and proximity to neighbouring nations are evident on the map, particularly where roads, railways, or waterways extend across or near borders. Strategic points such as ports, tunnels, or mountain passes can also indicate important connections or trade routes.
- Agriculture: Topographic maps help identify areas suitable for agriculture, such as flat lands, river valleys, and fertile soil regions. These areas may be indicated by the presence of settlements, irrigation networks, and cultivated fields visible in the landscape.
- Natural resources: While a topographic map does not explicitly identify specific resources like minerals or forests, it does highlight geographical features that suggest where resources might be located, such as mountainous areas (potential for minerals) or forests. Proximity to water bodies might indicate fishery resources or water for irrigation.
- Strategic strengths and vulnerabilities: Elevation data (contour lines) on a topographic map can highlight areas of military strategic importance, such as elevated positions for defence or vulnerable lowland areas susceptible to flooding or invasion. The map can also reveal choke points in infrastructure, such as narrow mountain passes or bridges, that might be significant in military planning.
In summary, a topographic map serves as a powerful tool for deducing a region’s physical characteristics, infrastructure, resources, and geopolitical context, offering insights into its settlement patterns, natural resources, agricultural potential, and strategic positioning.
Part I activity instructions
With the whole class: Brainstorm what we can learn about the following from a topographic map of the DPRK…
- Settlement patterns
- Watersheds and river systems
- Infrastructure networks
- Connections to neighbouring countries
- Agriculture
- Natural resources
- Strategic strengths and vulnerabilities
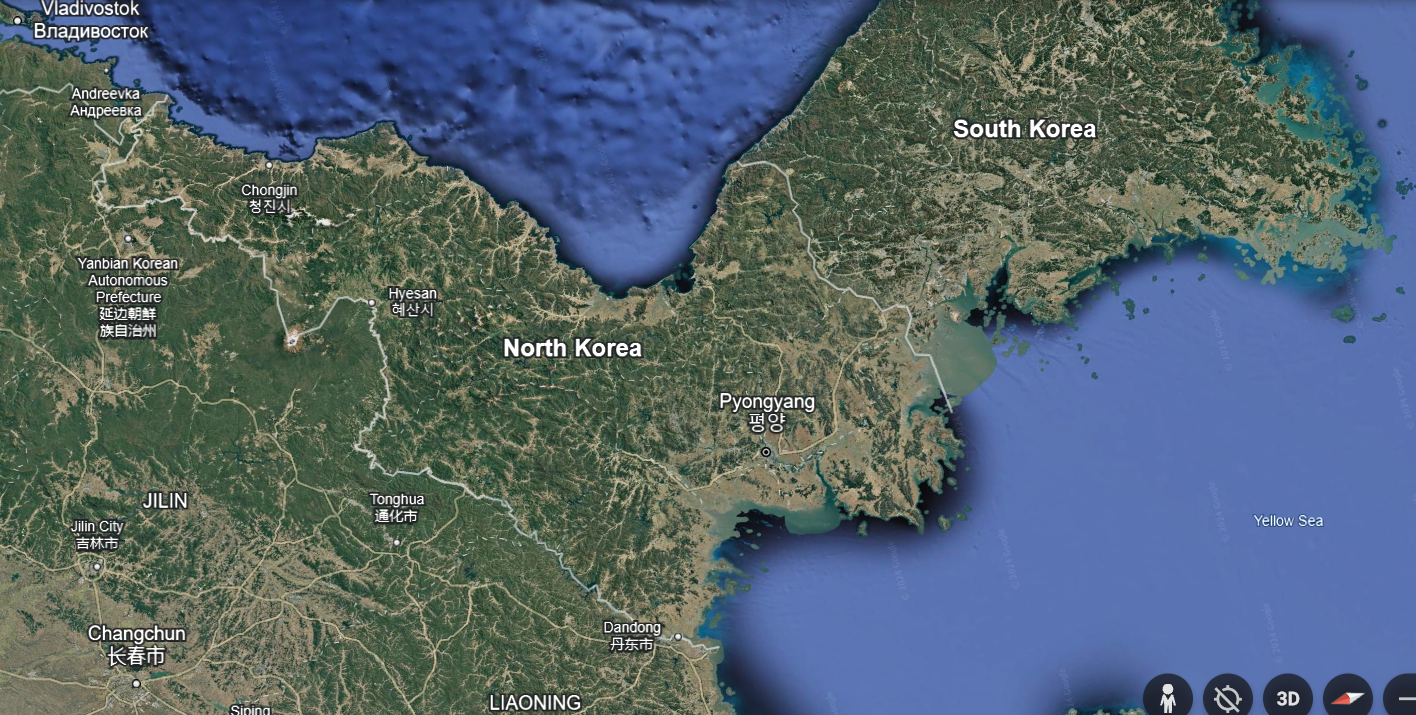
Part II: Independent exploration on Google Earth
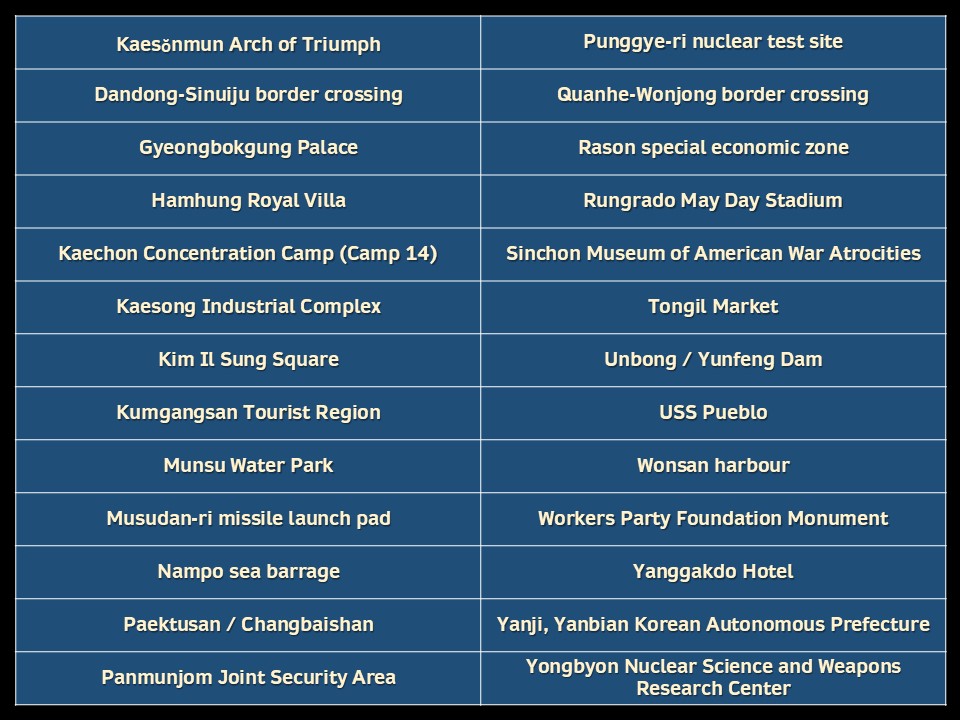
Students then use Google Earth to locate specific North Korean landmarks, ranging from military installations to industrial complexes. Guided by a treasure hunt table, students navigate satellite imagery to identify the significance of each site within the context of the subject. By integrating these visual insights with theoretical knowledge, students unravel the deeper implications of North Korea’s geography on its strategic priorities and global interactions.
To effectively use Google Earth for geospatial intelligence analysis in North Korean Studies, students should begin by understanding the foundational principles of geospatial intelligence. This involves analysing spatial data to uncover insights about geography and its implications on political, military, or environmental scenarios. In the context of North Korea, such analyses often focus on monitoring infrastructure, agricultural development, or military facilities. This often involves terrain analysis to comprehend the strategic importance of geographical features.
Part II activity instructions
On your own: Using Google Earth your laptop, tablet or phone, search for each of the landmarks listed in the table below.
- The first practical step is to download and install Google Earth Web. Once installed, familiarise yourself with its interface, focusing on satellite imagery and terrain visualisation.
- The search tool allows quick location of the sites on the treasure hunt list.
- Activate essential features like the Layers tool, enabling overlays for roads, borders, and other geographic markers.
- Use the timeline functionality within Historical Imagery to examine geographical changes over time, which is critical for understanding developments like infrastructure expansion or environmental degradation.
- Pair this with map tools for zooming, rotating, and tilting to view sites from various perspectives.
- Advanced features like the ruler tool are useful for measuring distances and areas.
Part III: Collaborative analysis
Working in small groups, students analyse their findings and consider the relevance of each landmark to actors in government, international organisations, business, and the NGO sector. They present their insights to the class, fostering peer learning and collective discussion about the geopolitical landscape of the Korean Peninsula.
Various actors in government, business, international organisations, and the NGO sector are likely to be consumers of geospatial information about North Korea, each with specific interests and objectives. These include:
- Foreign ministries, national security and defence agencies use geospatial data to monitor military activities, infrastructure developments, and potential threats from North Korea. GEOINT aids in tracking missile launches, military deployments, and assessing North Korea’s strategic capabilities.
- Energy and resource companies involved in energy, mining, or natural resource extraction may use geospatial information to assess the potential for resource exploration and infrastructure development. Geospatial data helps identify areas of interest for energy or mineral extraction, as well as infrastructure needed for transport or supply chains.
- Logistics and shipping companies involved in international trade or shipping may rely on geospatial data to understand port infrastructure, trade routes, and cross-border transportation dynamics with North Korea, especially considering its proximity to major trade partners like China and South Korea.
- United Nations agencies like the UNHCR and UNDP use geospatial data to assess humanitarian needs in North Korea, such as food security, access to healthcare, and environmental degradation. This data is also critical for crisis response planning and monitoring the situation along the border with South Korea and China.
- International organisations such as the World Bank may use geospatial data for socio-economic planning, assessing North Korea’s infrastructure, agricultural production, and overall developmental challenges.
- Multilateral security organisations like the United Nations Security Council (UNSC) use geospatial data to assess and monitor the regional security environment, including the proximity of military activities or developments that may influence broader regional stability.
- Humanitarian organisations, including NGOs focused on humanitarian aid like the International Red Cross and Médecins Sans Frontières, or human rights NGOs such as Human Rights Watch, rely on geospatial data to assess the regions in greatest need of assistance. This includes tracking access routes for aid delivery, identifying vulnerable populations, and assessing areas impacted by natural disasters or human rights abuses.
- Environmental NGOs such as Hanns Seidel Foundation use geospatial data to monitor deforestation, land use changes, and environmental degradation within North Korea, especially along the borders or in sensitive ecological areas.
- Academic researchers also use geospatial data in creating detailed maps for collaborative projects or individual research, to analyse satellite data to examine historically significant locations, cross-referencing findings with open-source intelligence (OSINT) for validation.
In summary, geospatial information about North Korea is critical for a wide array of stakeholders in the government, business, international organisations, and NGO sectors, each using it for purposes ranging from security and diplomacy to resource management, humanitarian aid, and environmental monitoring.
Part III activity instructions
In small groups of 3-4: Compare and contrast your individual observations with groupmates on the following…
- Describe what you see at each site on the treasure hunt list.
- Explain why each site is significant, in the context of what we have learned about North Korea over the course of the subject.
- Identify actors in government, business, international organisations, and/or the NGO sector who are likely to be consumers of this information. Explain how and why they might use GEOINT data.
Summary
The geospatial treasure hunt is an example of easy-to-deploy hands-on experiential learning in the International Relations classroom. By blending technical skill-building with critical inquiry, the activity equips students to assess both the tangible and strategic dimensions of North Korea. This immersive approach not only enhances their understanding of the geopolitical dynamics on the Korean Peninsula, but also positions them for future roles in academia, diplomacy, defence, business, or NGO sector.
Ultimately, the exercise underscores the enduring relevance of geography in shaping our world and inspires students to think critically about the interplay of land, power, and politics on the Korean Peninsula.

[…] of political events. Every good IR practitioner is unashamedly a map nerd and even learning basic geospatial intelligence skills on Google Earth is a good […]
[…] activity presented here could also usefully be paired with the geospatial learning activity in The IR classroom: North Korea geospatial intelligence ‘treasure hunt’, to add a visual and spatial element to the class […]