Visualising economic interdependence
Being able to visualise trade networks and economic interdependence is essential for International Relations students who want to understand the dynamics of liberal internationalism, particularly at a time when the global economy is fracturing through Sino-American economic decoupling.
From 2011 to 2021, I taught Security in the Indo-Pacific, a Masters-level subject at La Trobe University. The course equipped students with theoretical and practical tools to analyse regional security challenges, using various geospatial and signals intelligence resources to help students understand patterns of economic cooperation across the Indo-Pacific region.
The individual research assignment articulated in this article is inspired by class activities from this subject, focused on mapping and conceptualising economic interdependence in the Indo-Pacific by analysing maritime and air trade routes using live transponder data from Marine Traffic and AirNav Radar.
Students will use Network Analysis to explain the relationships between key economic hubs, trade routes, and interdependencies in regional trade, as visualised in these live data sets. Network Analysis is a specific structured analytical technique laid out in Pherson and Heuer’s 2021 book Structured Analytic Techniques for Intelligence Analysis (3rd Edition).
Activity instructions
The learning activity demonstrates how economic interdependence fosters liberal internationalism while exposing vulnerabilities in global supply chains. By completing this network mapping and analysis task, students should develop a nuanced understanding of how trade networks operate and the role of economic interdependence in fostering cooperation and stability in the Indo-Pacific region.
This individual research assignment combines theoretical understanding with practical skills, requiring students to independently gather and analyse geospatial data. Students will enhance their skills in geospatial data analysis, network mapping, and critical writing—essential for careers in trade policy, international development, and economic diplomacy. This task mirrors real-world challenges in international trade and policy analysis, fostering critical thinking and preparing students for professional roles in these fields.
Research preparation
Before beginning, clarify the objective of the assignment: to map and analyse economic interdependence in the Indo-Pacific. Review the relationship between trade networks and economic interdependence (mutual reliance for goods and services).
- Economic interdependence: This occurs when nations rely on each other for trade, resources, and services.
These concepts will guide your analysis and interpretation of data. Refer to course materials or academic readings on trade networks and economic diplomacy for context.
It is important to clearly define the purpose of your network map and decide on its scope (i.e. its geographical or thematic focus). In this case, your purpose is to map and analyse economic interdependence in the Indo-Pacific using live data from Marine Traffic and AirNav Radar.
Real-time ship and aircraft transponder data is best understood as a form of signals intelligence (SIGINT). Systems like the Automatic Identification System (AIS) for ships and the Automatic Dependent Surveillance-Broadcast (ADS-B) for aircraft transmit essential data, including location, speed, direction, and identification.
This information plays a vital role in both military and civilian contexts. Militaries utilise it to monitor adversarial movements, while civilian agencies rely on it for purposes such as air traffic management, maritime safety, and search-and-rescue operations. When such data is made publicly accessible through online tracking platforms, it also serves as a valuable resource for open source intelligence (OSINT), which is what you’ll be accessing through Marine Traffic and AirNav Radar.
SIGINT data collection
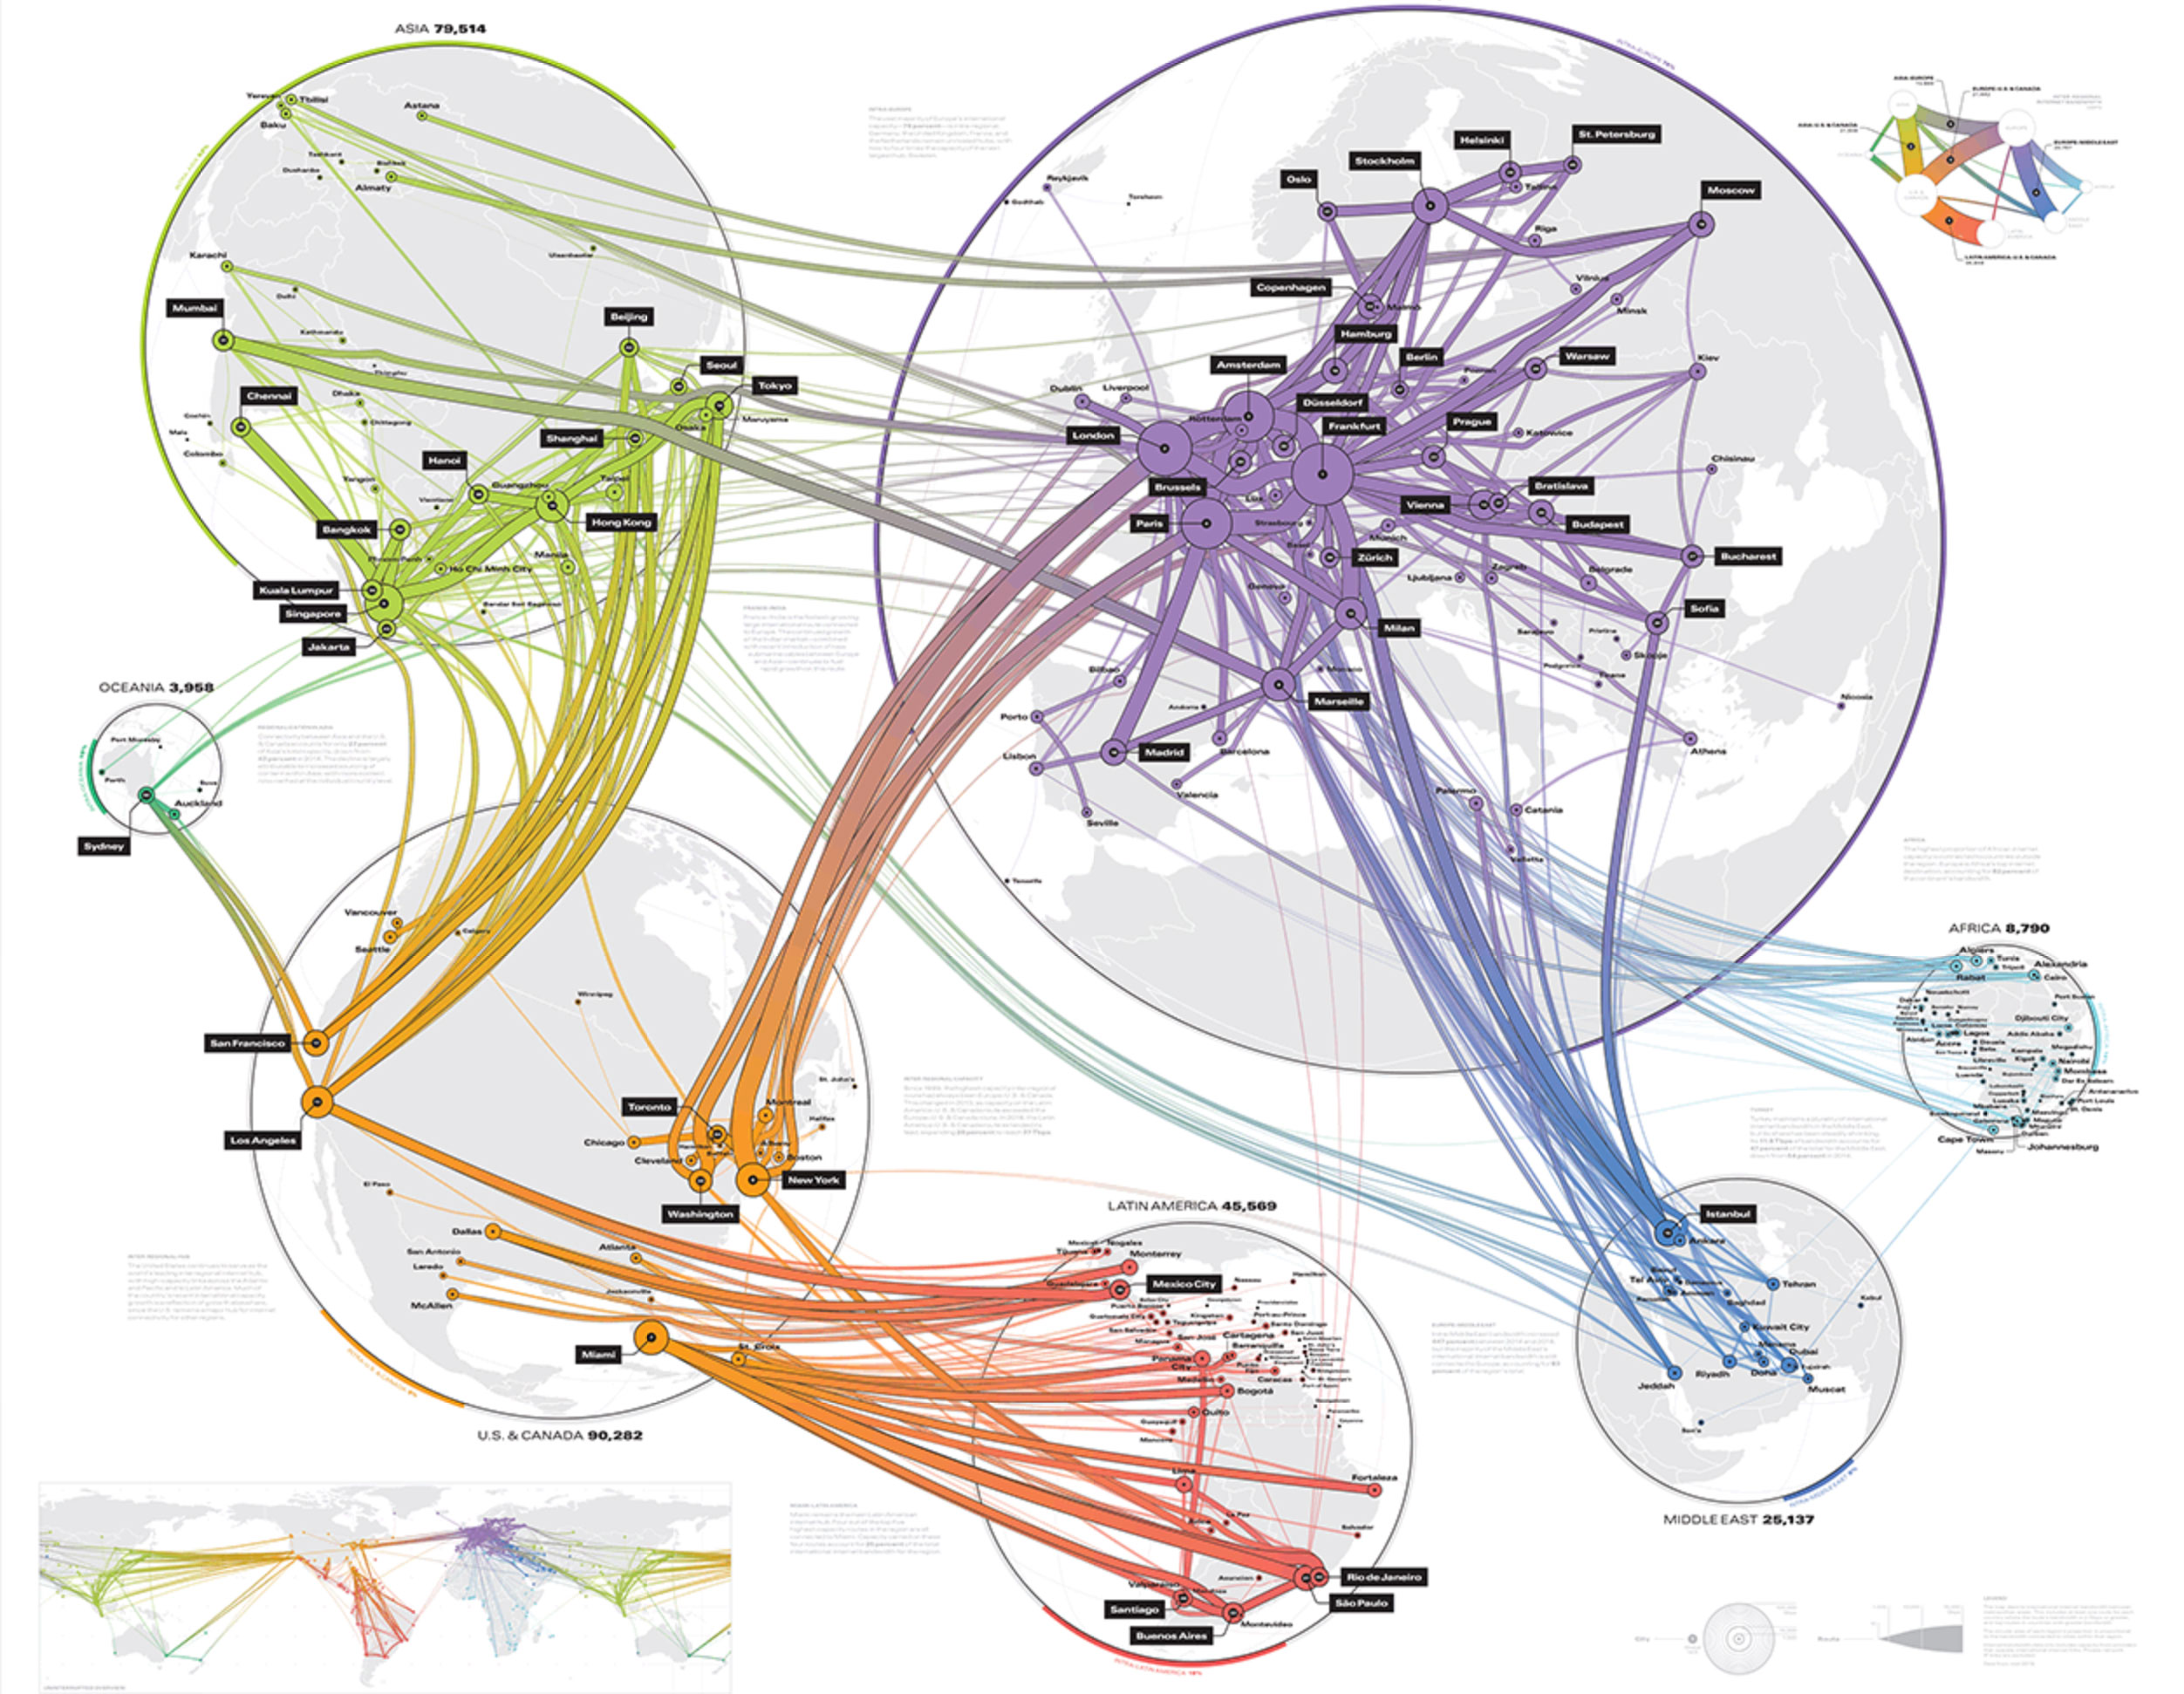
A network map is a visual representation of relationships or connections between key entities (nodes) in a system (Pherson and Heuer 2021, pp. 231-240). In the context of International Relations, it is an effective tool for analysing complex networks such as trade routes, alliances, or institutional interdependence.
Components of a network map include:
- Nodes: These are entities like ports, airports, or economic hubs.
- Networks: Connections between nodes, representing trade routes or air corridors.
- Attributes: Details like the trade volume, flight frequency, or geopolitical significance of the connection.
Use the real-time ship and aircraft transponder data from Marine Traffic and AirNav Radar respectively to identify key nodes, networks and attributes of those transportation networks.
Marine Traffic data
Open the Marine Traffic interactive map and focus on key maritime trade routes in the Indo-Pacific region.
- Identify key data points, including major ports (nodes), origins and destinations of vessels (flows), shipping density and trade volume (where traffic is most concentrated), and types of vessels (e.g. container ships, oil tankers).
- Use a table or spreadsheet to record your data points.
AirNav Radar data
Open the AirNav Radar interactive website and focus on key air routes in the Indo-Pacific region.
- Identify key data points, including major airport hubs (nodes), origins and destinations of flights (flows), flight frequencies and volumes (where traffic is most concentrated).
- Use another table or spreadsheet to record your data points.
Consolidate findings into a single table or spreadsheet for ease of mapping, categorising data by node (port or airport), network (flows), and attributes (e.g. shipping volume or flight frequency).


Network mapping
Now it’s time to create your network map.
Constructing a network map by hand is cumbersome, so choose a software app like Lucidchart, Gephi, or Miro to create a digital map.
Place the nodes—ports and airports—on a geographical layout or thematic grid.
Connect the nodes by drawing lines between them to represent trade and transport networks. Use different line styles (e.g., thickness or colour) to indicate network strength or frequency.
- Solid lines for strong connections (e.g. high volume and frequency).
- Dotted lines for weak connections (e.g. occasional volume and frequency).
- Arrowheads to indicate directionality (e.g. export routes or flight paths).
Annotate your map with labels for nodes and networks to provide clarity. Label nodes with their names and networks with their attributes. Include a legend explaining node and network types.
Network analysis
Once you have constructed your network map, analyse and refine your observations.
- Identify patterns, lookingfor clusters, chokepoints, or highly connected nodes. These often represent strategic hubs or critical dependencies.
- Highlight key insights by using special annotations or colour-coding to emphasise findings, such as vulnerabilities (e.g., reliance on a single chokepoint) or opportunities (e.g., robust trade networks).
- Refine the map based on feedback and/or additional data to ensure clarity and accuracy.
By following these steps, a network map can serve as a powerful analytical tool to uncover relationships, dependencies, and strategic insights within complex systems.
Write the analytical report
The final deliverable is a network map and a 4,000-word analytical report. The report should be written with a clear structure and citations from academic literature.
The report should include the following elements:
- Introduction: As a framing for the report, clearly introduce your key findings, explain why your findings are important; and outline you key supporting evidence.
- Conceptual definitions of economic interdependence and its importance in the Indo-Pacific.
- Explain in detail the key findings from your network map, such as major hubs, dominant routes, and critical chokepoints.
- Analyse how your findings illustrate economic interdependence. Also highlight potential risks of economic interdependence and/or any evidence of economic decoupling.
- Conclusion: Reflect on the implications of economic interdependence for patterns of regional cooperation and stability.
- Include your network map in the report as a visual aid to support your analysis.
Closing reflections
This research assignment provides students with a valuable opportunity to connect theoretical concepts with practical analysis, deepening their understanding of economic interdependence in the Indo-Pacific.
Through this process, students begin to appreciate the interconnectedness of global trade networks and the vulnerabilities inherent in the global supply chain. The exercise encourages critical reflection on the dynamics of liberal internationalism, demonstrating how cooperative relationships foster peace and stability, while also highlighting potential risks such as chokepoint reliance or regional disruptions.
The integration of both maritime and air trade routes underscores the complexity and scale of the Indo-Pacific region, offering students an insight into how global economic forces shape dynamics of cooperation and conflict.
Ultimately, this assignment equips students with the skills necessary to analyse real-world trade networks, preparing them for careers in international trade, policy analysis, and economic diplomacy. By combining SIGINT analysis with theoretical frameworks, students are positioned to critically engage with the challenges of our increasingly interconnected world and contribute meaningfully to the discourse on regional security and global cooperation.
Reference
Randolph H. Pherson and Richards J. Heuer Jr. (2021) Structured Analytic Techniques for Intelligence Analysis. 3rd Ed. Thousand Oaks: SAGE and CQ Press.

You must be logged in to post a comment.